Researchers from across the CGIAR -- in a non-pandemic year at least -- survey a total of around 180,000 households a year to get baseline information about people's livelihoods and measure intervention impacts. Interviews with each household can take hours of scientists' and farmers' time, surveys are often designed anew by each research group, and similar questions are asked in different and incompatible ways.
Even if two research projects are both working on, say, crop-based interventions on smallholder farms, if they've each used their own survey, "it's usually impossible to compare much between one survey and another," says Jim Hammond from the International Livestock Research Institute (ILRI).
The data often hasn't been accessible to other researchers, either.
"There's enormous amount of information generated, that is used in specific projects and specific applications, but then it sort of disappears," says Mark van Wijk, also from ILRI.
This inefficiency and waste -- of time as well as of data -- led van Wijk, Hammond and their team to create a low-cost, standardized tool that allows researchers and development organizations to quickly and consistently collect house-hold level data.
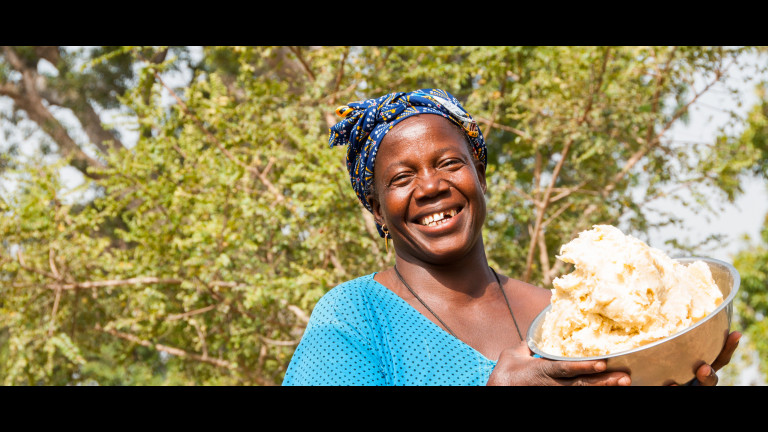
Mai Tu/ILRI-Alliance Bioversity CIAT
Called RHoMIS -- the Rural Household Multi-Indicator Survey -- it makes designing and carrying out surveys quicker and easier for those in the field. Since it was developed in 2015, RHoMIS has been used to survey more than 33,000 households by 13 organizations, including Tree Aid, the International Fund for Agricultural Development (IFAD) and several CGIAR centers.
While these organizations use the tool to guide their own initiatives and measure impact, the data they produce is also anonymized and assembled to create consistent, standardized data sets that allow researchers to compare results across projects, regions and countries.
That has led to some important insights, says van Wijk -- and some cautionary tales.
In one study, van Wijk and colleagues were able to use the 'big data' generated by RHoMIS to show that increasing food security through increasing market engagement on small farms doesn't improve gender equality -- in fact, it frequently undermines it.
Across a wide range of different farming systems in both West and East Africa, they found a strong negative relationship between improved market access for crops and livestock, and an indicator they call 'female control' -- derived from questions in the survey asking women how much power they had over money and household decisions.
What they discovered was that when goats or chickens were kept for household consumption it tended to be women's business. But when interventions started encouraging women to sell the meat or livestock for cash, "men also become interested in those activities," says van Wijk. "They start going again to the market to sell those goats -- and then the money disappears into the pockets of the men, and you hope that they bring it back to the family to buy food for the children."
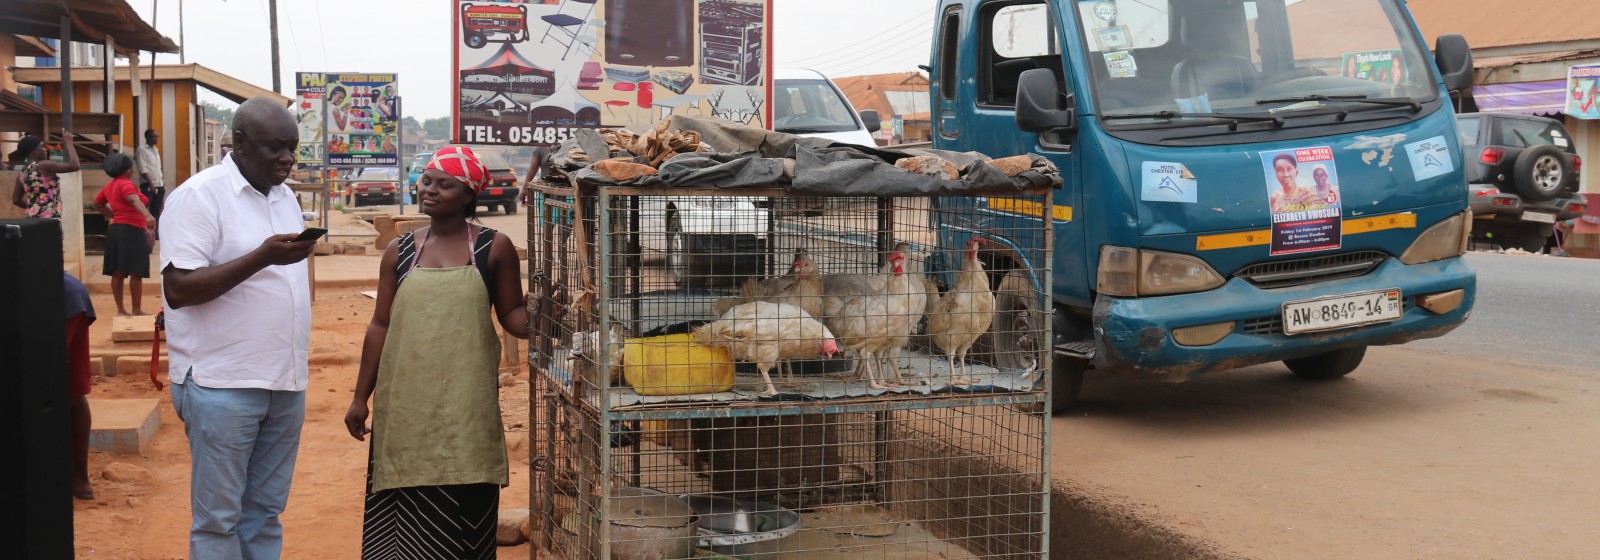
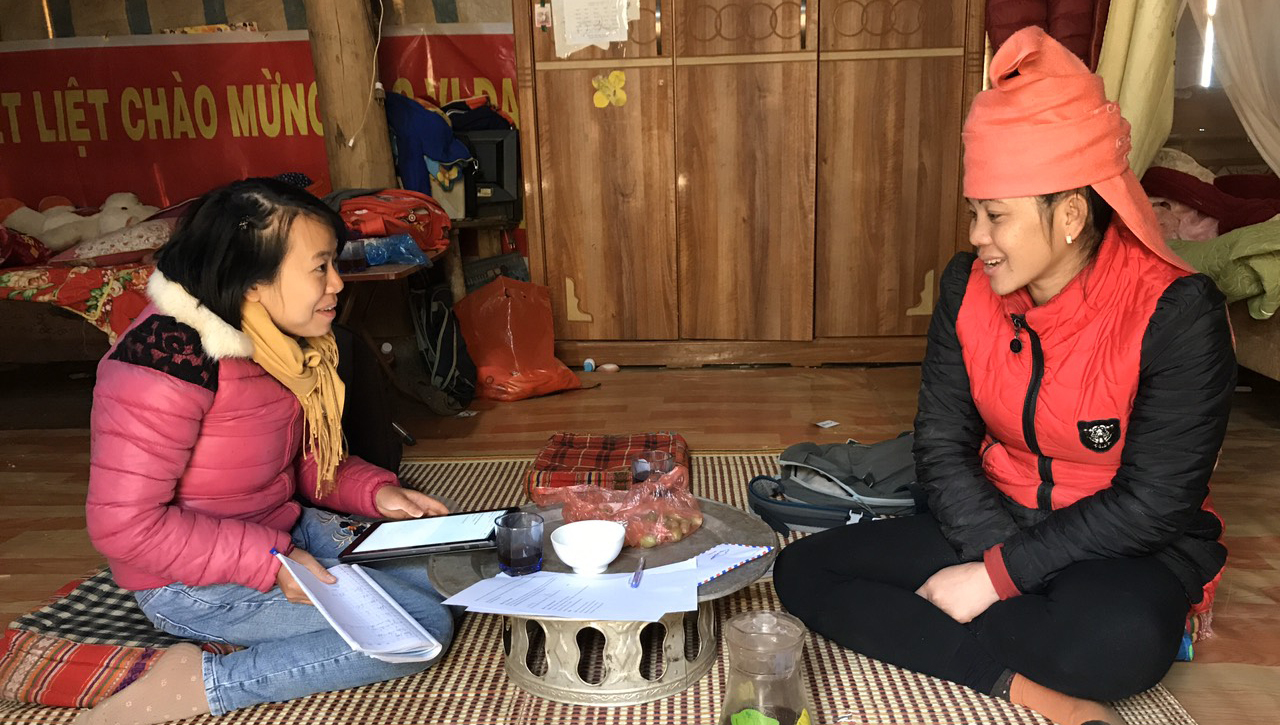
Photo A. Galiè/ILRI
Interventions aiming to increase sales of legumes and eggs have less of a negative effect -- though not a positive one. Organizations that don't explicitly factor these findings into their work risk exacerbating gender inequality.
"You have to be careful when you roll out technologies or interventions because they are likely to have negative effects in terms of the women's control over the benefits of that production," says van Wijk. (It's not just an African problem.)
Another insight concerns dietary diversity. Many agricultural organizations encourage farmers to diversify their production, assuming that it will lead to more diverse diets, as well -- and thus improved health outcomes.
But the RHoMIS data has highlighted that that's not always the case. Most farmers grow some of what they eat, but buy some too, using cash from selling produce and family members’ work off the farm. Which crops they keep for themselves depends on a host of factors, including whether they are able to store it through the lean periods of the year.
"In most of the analysis we did, we showed that a kind of middle strategy -- consuming what you have on farm, but also having a smart strategy in terms of selling produce and buying certain food groups, is actually the best strategy to get diverse diets. And that's something I wouldn't have expected," says van Wijk. "Simply pushing for production diversity won't lead directly for many households to better diets."
That suggests we need to think in a more integrated way about agricultural interventions and the off-farm economy, adds Hammond.
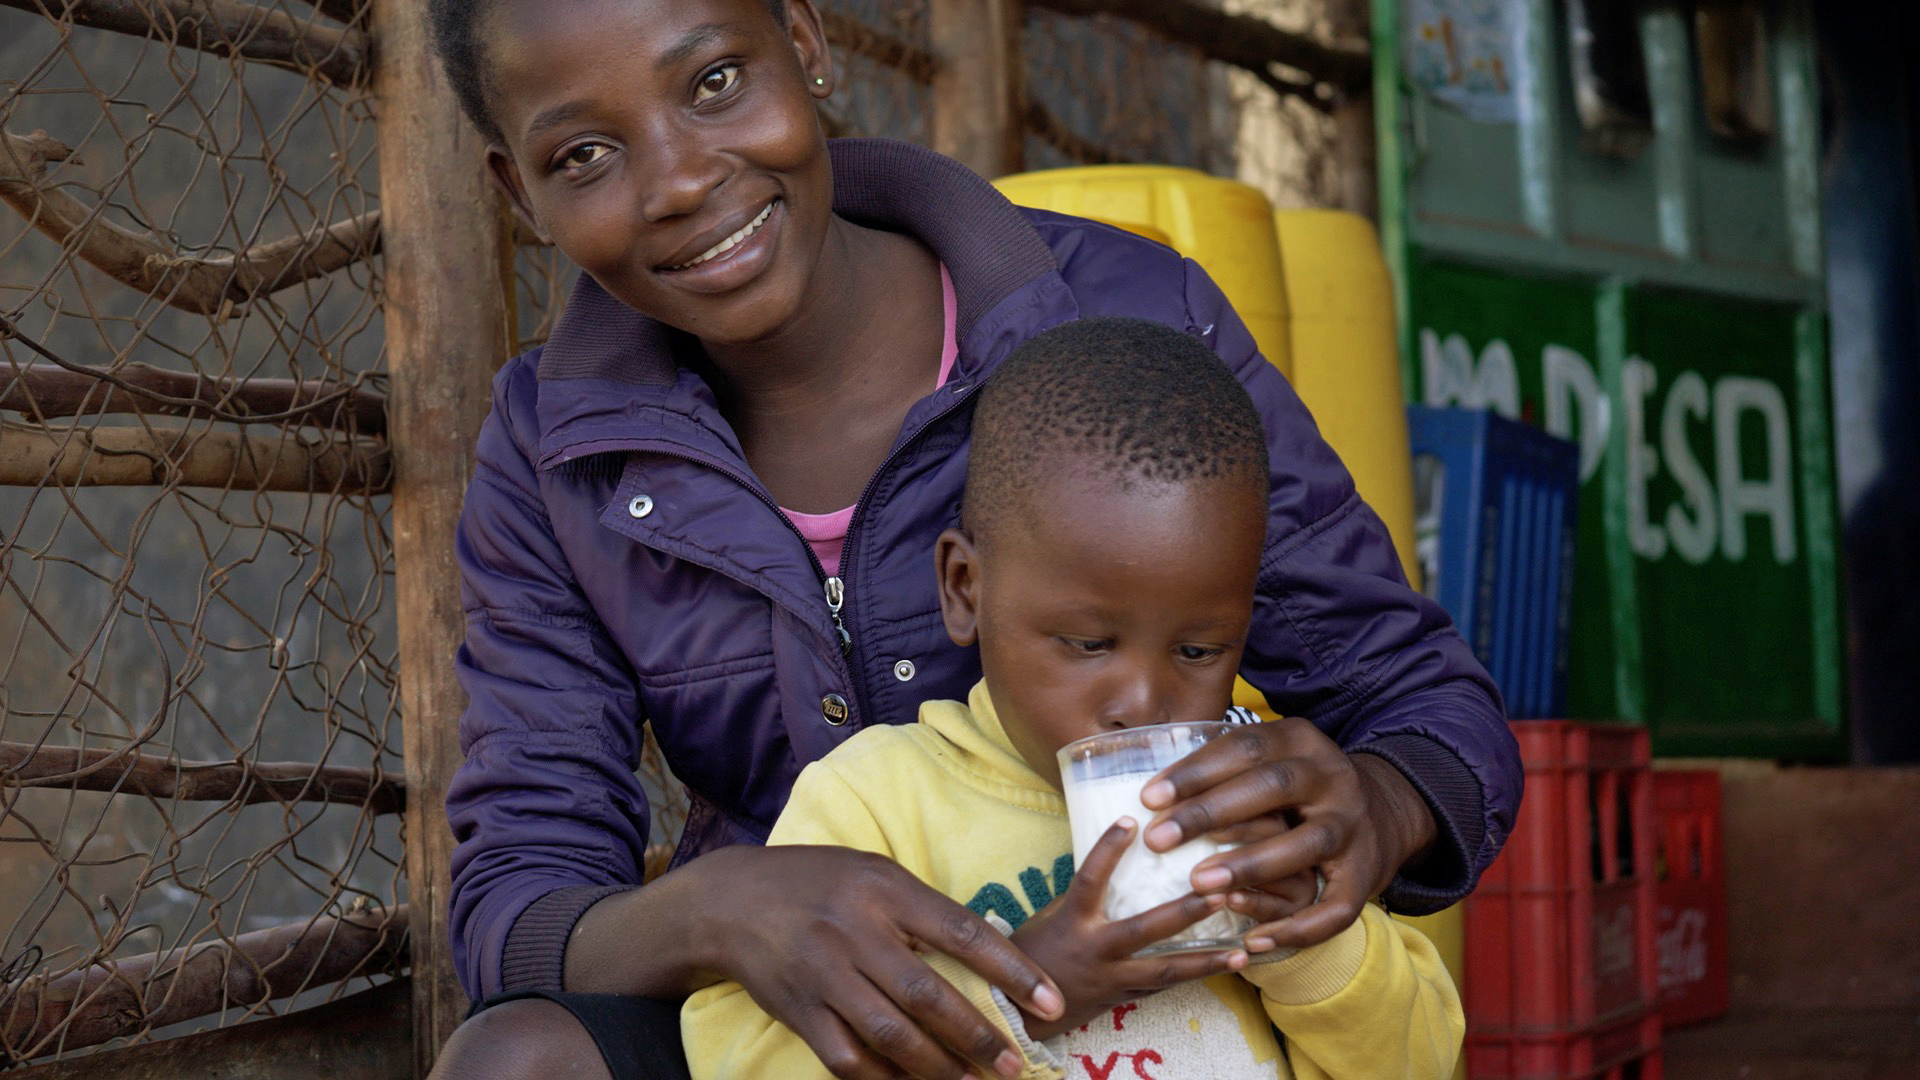
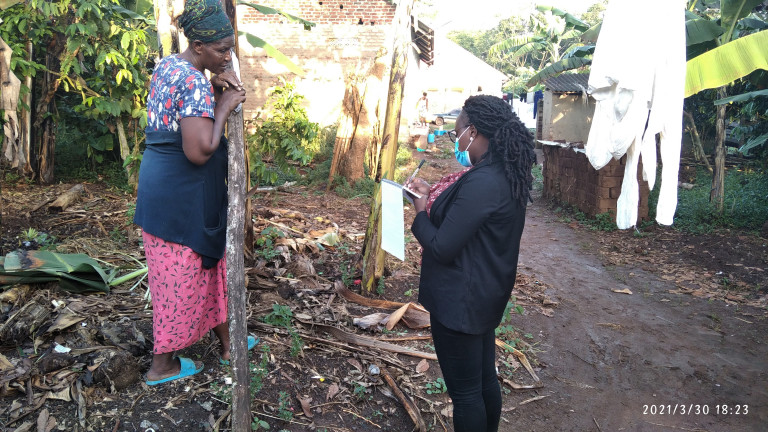
Photo S. Isingoma/ILRI
The big chicken mystery
Overall, RHoMIS has the potential to give researchers and agricultural development practitioners more insight into which trends and outcomes are universal, and which are regionally specific.
"People often like to apply silver bullets, or rollout technologies on a large scale," says van Wijk. But the deep, broad database derived from RHoMIS surveys means researchers can now dig into which interventions are most likely to work for a particular group of households in a particular kind of setting.
"We can tease apart the different levels of influence," says Hammond.
Van Wijk and Hammond have big dreams for RHoMIS. They hope to turn the tool into a computer program that NGOs and researchers would be able to use without their help, and plan to add remote-sensing data to the database, enabling researchers to draw conclusions about how different land-use types or landscapes might affect outcomes.
RHoMIS is also being updated with additional questions about how smallholders are responding to the disruptions caused by the COVID-19 pandemic, giving real-time data to help organizations respond to a fast-changing world.
The tool also has the potential to answer longstanding mysteries like, 'what do people do with their chickens?' RHoMIS data has shown that around 70 percent of households keep chickens, but on average, only about a third of them slaughter and eat them, and only 10 percent eat the eggs, says Hammond. "It's still a mystery why so many people keep chickens if they're not eating them or the eggs. What are people actually doing with them? With RHoMIS, we can begin to dig into those kind of questions."
The more people use the tool, the more opportunities there will be for this kind of big-picture analysis. Researchers are currently using RHoMIS for around 10,000 households per year, and with 200,000 surveys done per year in the CGIAR alone, there's plenty of potential to scale up.
"It's tricky, because people want to use their own tool," says van Wijk.
"But at least we have shown that we can generate an enormous information base, and important findings. We hope that's the carrot for people to join with us in this community of practice."
--
Learn more
Blog: A tool for all seasons: A ‘lean’ household survey system for ‘minimal effort, maximum information’ comes of age (Feb 2020, ILRI)
Journal article in Nature: The Rural Household Multiple Indicator Survey, data from 13,310 farm households in 21 countries (11 Feb 2020)
Paper: The Rural Household Multi-Indicator Survey (RHoMIS) for rapid characterisation of households to inform climate smart agriculture interventions (Feb 2017)
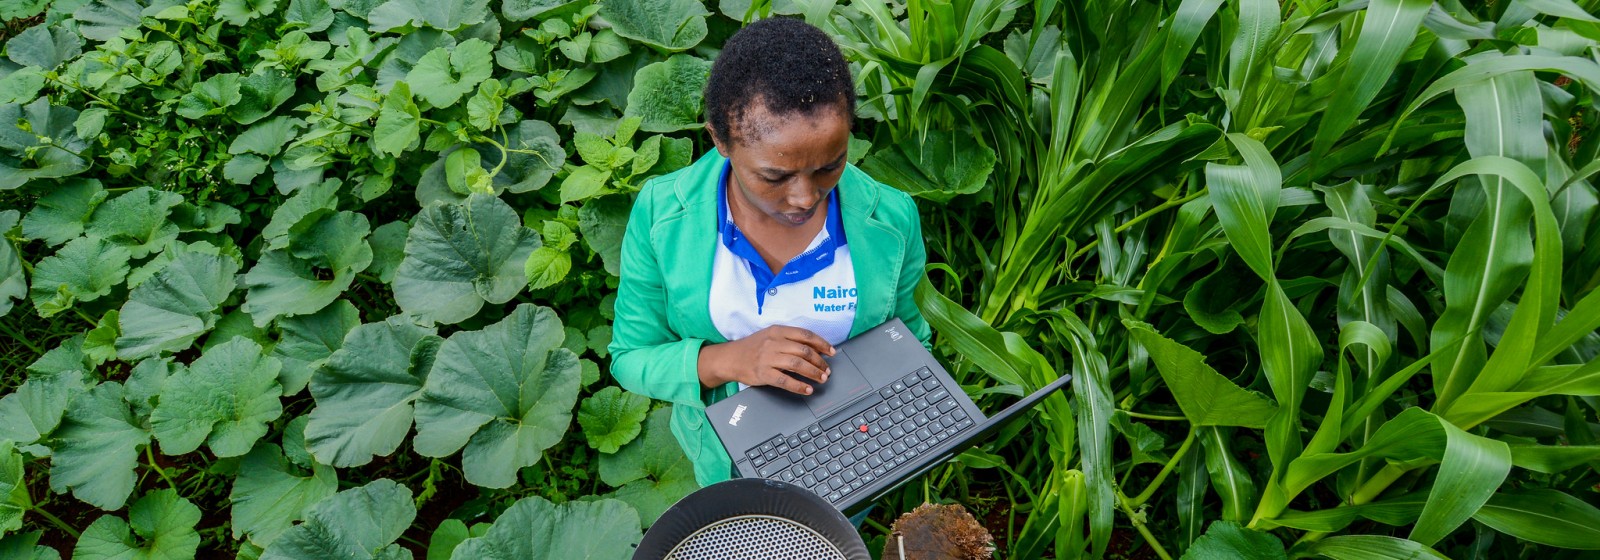
Banner photo Georgina Smith/CIAT